The state has created an interactive, online map providing a realistic look at the future, which probably will be more shocking to residents than the words in the new Coastal Master Plan it is based on.

Learn more about coastal rebuilding at a public meeting WednesdayMetro area residents can comment on the draft version of the 2017 Coastal Master Plan at a public meeting Wednesday at the Port of New Orleans Auditorium, 1350 Port of New Orleans Place. To get there, turn onto Henderson Street from Tchoupitoulas Street as if you’re going to Mardi Gras World.The forum is being held by the Coastal Protection and Restoration Authority.An open house at 3:30 p.m. will give attendees an opportunity to get information about the 2017 Master Plan, as well as the 2018 Annual Plan outlining activities for the coming fiscal year.People will be able to discuss the plan with agency personnel. None of those conversations will be recorded, but attendees can file official comments on a computer set up for that purpose.The public meeting will start at 5:30 p.m. with an explanation of the plan. A public comment period will follow.Mandeville meeting Jan. 25Another public meeting will be held in Mandeville Jan. 25 at the David C. Treen Instructional Technology Center, 2024 Livingston St. The same schedule will be followed.

In bright, alarming colors, the interactive map shows that in the decades ahead, more and more of the state will go underwater or will be subject to catastrophic flooding — even if the coastal plan accomplishes all of its goals.

The reason, according to the state scientists who developed the plan and the map, is that there’s a rising threat from sea level rise largely due to carbon emissions from the burning of fossil fuels.

The interactive viewer is designed to give residents a realistic idea of what the future holds over the next four decades as the Gulf of Mexico rises and the sediment-starved delta landscape continues to sink.

Viewers can see what will happen across the entire coast or their own communities under three scenarios of sea level rise, with and without the state’s plan to rebuild and protect the coast. Estimates of sea level rise are tied to future levels of greenhouse gases; greater emissions result in greater, faster sea level rise.

The interactive map also allows people to see estimates of economic damages in communities as flood risk and land loss increase over the decades.

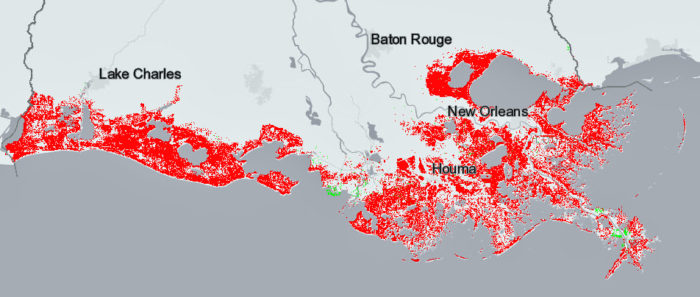
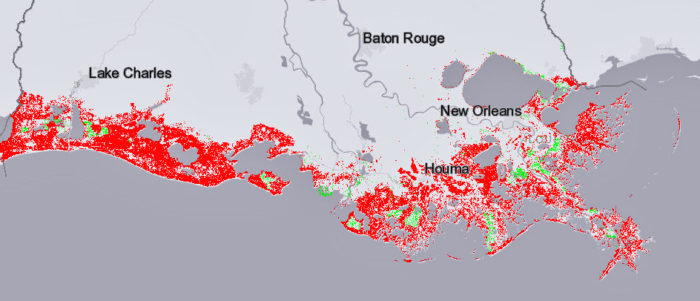
Flood risk under low greenhouse-gas scenario

This map shows the flood risk under the state's scenario if greenhouse gas emissions are held to a relatively low level. Purple areas would see at least 16 feet of flooding in a 100-year storm; teal would have 13 to 15 feet; dark green would have 10 to 12 feet; light green would have 7 to 9 feet; yellow would see 4 to 6 feet; orange would see 1 to 3 feet.
This map shows the flood risk under the state’s scenario if increases in greenhouse gas emissions are held to a relatively low level. Purple areas would see at least 16 feet of flooding in a 100-year storm; teal would have 13 to 15 feet; dark green would have 10 to 12 feet; light green would have 7 to 9 feet; yellow would see 4 to 6 feet; orange would see 1 to 3 feet. Credit: Coastal Protection and Restoration Authority

Flood risk under high greenhouse-gas scenario

This map shows the flood risk under the state's scenario if greenhouse gas emissions continue to increase, causing sea levels to rise more. Purple areas would see at least 16 feet of flooding in a 100-year storm; teal would have 13 to 15 feet; dark green would have 10 to 12 feet; light green would have 7 to 9 feet; yellow would see 4 to 6 feet; orange would see 1 to 3 feet.
This map shows the flood risk under the state’s scenario if greenhouse gas emissions are not brought under control, causing sea levels to rise more. In a 100-year storm, much more of the coast would see flooding of at least 16 feet (shown in purple). Areas in teal would have 13 to 15 feet of flooding; dark green would have 10 to 12 feet; light green would have 7 to 9 feet; yellow would see 4 to 6 feet; orange would see 1 to 3 feet. Credit: Coastal Protection and Restoration Authority

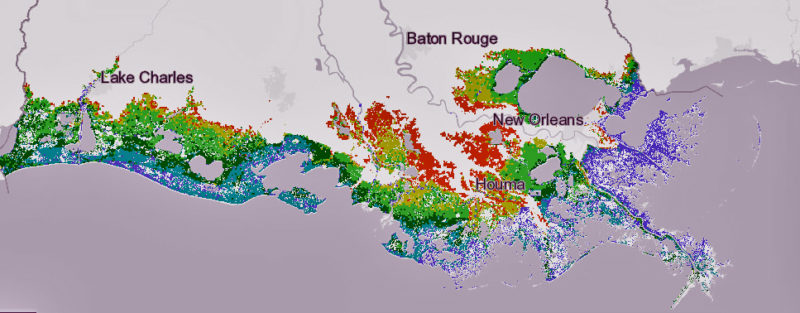
Projected land loss with coastal restoration and low emissions

Red shows where land would be lost and green shows where it would be gained in 50 years if greenhouse gas emissions are lowered and the plan accomplishes its goals.
Red shows where land would be lost and green shows where it would be gained in 50 years if greenhouse gas emissions are controlled and the coastal restoration plan accomplishes its goals. Credit: Coastal Protection and Restoration Authority

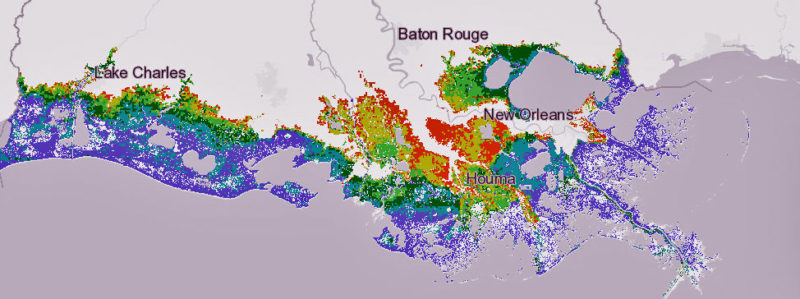
Projected land loss with coastal restoration and high emissions

Under this scenario — if greenhouse gases are not lowered, but the state accomplishes its coastal restoration goals — more land would be lost in 50 years.
Under this scenario — if greenhouse gas emissions are not controlled, but the state accomplishes its coastal restoration goals — more land would be lost in 50 years. Credit: Coastal Protection and Restoration Authority

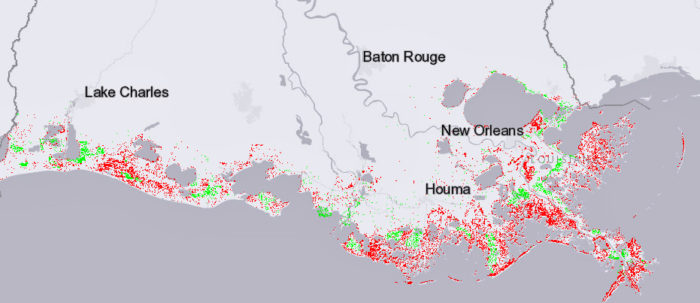
Projected land loss without coastal restoration and high emissions

This is the worst of the state's projections, showing widespread land loss. This is what would happen if greenhouse gas emissions are not lowered, causing relatively high sea level rise, and the state does nothing more to rebuild and protect the coast.
This is the worst of the state’s projections, showing widespread land loss. This is what would happen if greenhouse gas emissions are not controlled, which would cause relatively high sea level rise, and the state does nothing more to rebuild and protect the coast. Credit: Coastal Protection and Restoration Authority / Coastal protection and Restoration Authority

Bob Marshall

From 2013 to 2017, Bob Marshall covered environmental issues for The Lens, with a special focus on coastal restoration and wetlands. While at The Times-Picayune, his work chronicling the people, stories...