By Richard Campanella, The Lens contributing opinion writer |
I’m not a fan of The 73. The 73 New Orleans Neighborhoods, that is.
Don’t get me wrong; I love our neighborhoods (small “n”), and have spent years researching, mapping, and exploring them.
It’s the map of The 73 “official” Neighborhoods (capital “N”) that I’m skeptical about.
You’ve seen it: that authoritative jigsaw puzzle of straight lines and 90-degree angles, which bewitches bean-counters and bureaucrats but bewilders the average bum. How many New Orleanians can locate the Neighborhood called “Plum Orchard”? Or would distinguish between “Tremé” and “Sixth Ward,” even though Tremé occupies the Six Ward? Or would agree that a single neighborhood (St. Roch) borders both Marigny a few blocks from the French Quarter, and the former St. Bernard Housing Project all the way over by City Park?
Where did The 73 come from, and what’s wrong with them?
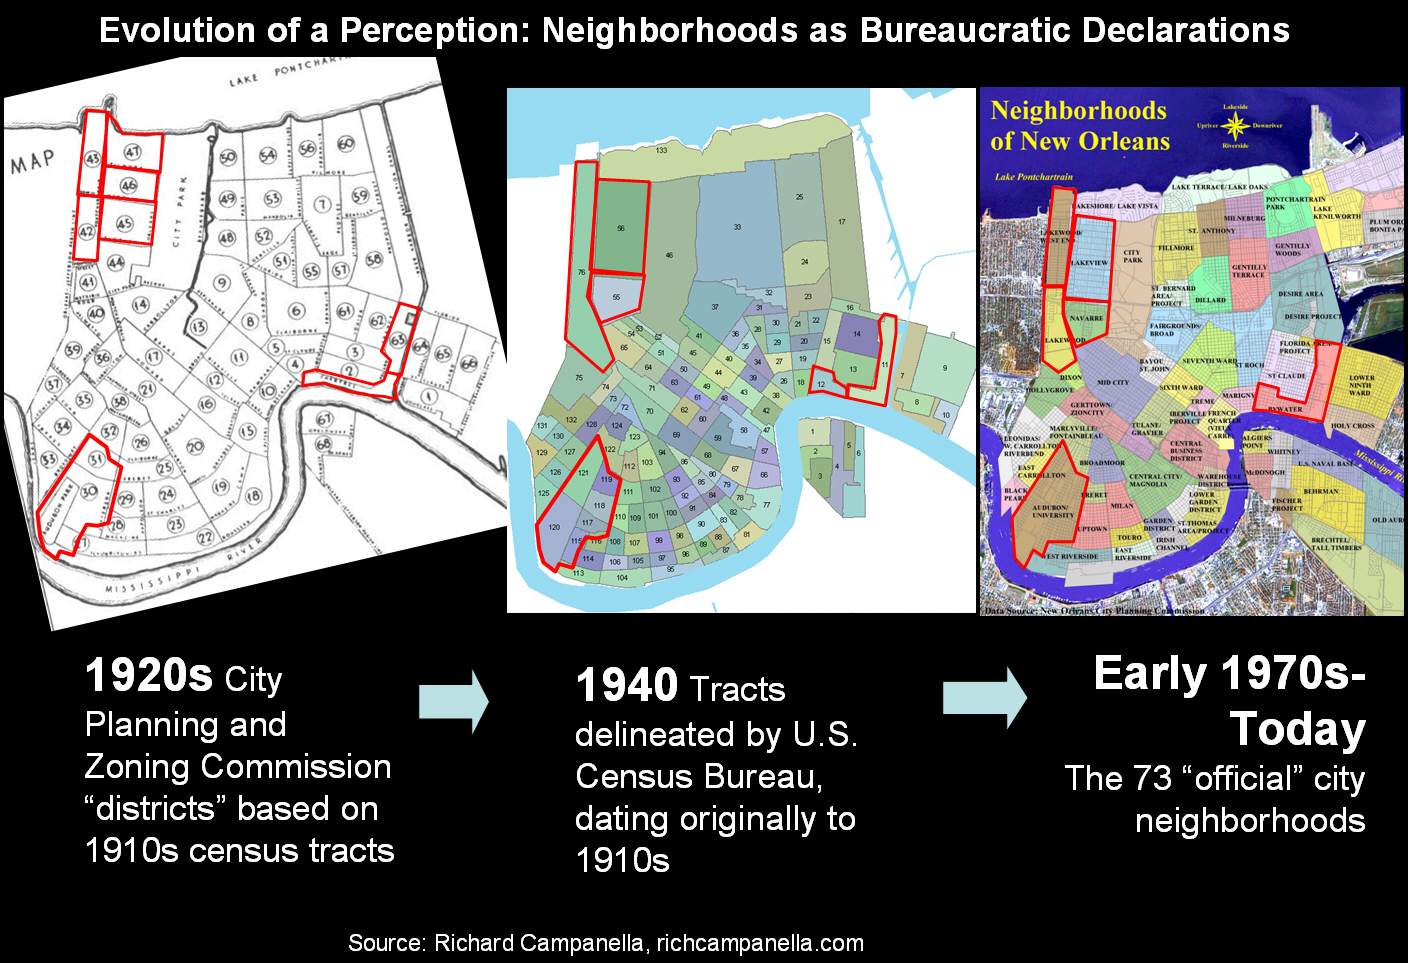
The 73 are traceable to early-1900s delineations created by the U.S. Census Bureau as it experimented with better ways to aggregate demographic data. These early “census tracts” were adopted by New Orleans’ first City Planning and Zoning Commission in the 1920s, which called them “districts” and used them for cartographic and planning purposes. As the city grew, new units were created and old ones modified by both agencies. No one called them “neighborhoods,” and New Orleanians continued to perceive their urban space as fuzzy-edged and refer to it with vernacular names.
That began to change after 1973, when the architectural firm Curtis and Davis reworked those extant districts and tracts vis-à-vis natural barriers, transportation arteries, socio-economic patterns, and historical plats. Its New Orleans Housing and Neighborhood Preservation Study created 62 official Neighborhoods, each comprising a carefully drawn polygon with a name that was sometimes familiar, other times invented. Later studies changed some names and lines and increased the number to seventy-three. Inspecting the early-1900s census tracts and the 1920s-era districts clearly demonstrates the provenance of The 73.
Planners, neighborhood associations, researchers, and journalists have since widely adopted The 73. Katrina further entrenched the map, as out-of-towners seeking spatial clarity in the messy city embraced the system unquestioningly. The 73 currently circulate in GIS form, in countless theses and dissertations, and all over the Internet. They are here to stay. And, frankly, they do a decent job of enabling analysts to simplify and report large amounts of raw data in a readable fashion.
So what’s the problem?
The problem is we read too much reality into The 73. They originated from a mere technical need on the part of demographers and planners, but we’ve come to view them as cultural-geographical gospel.
In fact, they are mostly arbitrary and artificial. With some exceptions (water bodies, large parks, and parts of the I-10 corridor), most of The 73’s edges have little or no relationship to cultural or physical ground-truth. They are built around the problematic premise that neighborhoods have strong peripheries and weak cores (in fact, the opposite is the case), and that avenues and boulevards divide urban space (in fact, they unite them).
Could I delineate neighborhoods any better? No. The exercise of drawing neat, orderly polygons on chaotic, contested urban space necessarily produces arbitrary and artificial units. Humanity, like nature, resists straight lines and 90-degree angles.
Neighborhoods, I believe, have soft, porous geographies defined and named best by those who live there. They are deeply revealing of history, culture, and group viewpoints, and vary complexly over time. Understanding them requires a healthy dose of postmodernism: a willingness to question the received wisdom, come to terms with uncertainty and ambiguity, and accept the possibility of multiple truths. You can learn a lot about this city and its people by adopting that mindset.
Reading too much reality into The 73 throws all this in the garbage can, and caters instead to doctrinaire bureaucrats and pedantic activists. It creates and perpetuates the notion that cities are the products of the authorities who manage them, and that space and place are best left to the professionals to describe and inscribe with character. It accommodates the dubious philosophy that those at the top control society’s narrative. It’s the same dogmatic instinct that, in other contexts, leads people to insist that there is only one correct way to pronounce “New Orleans,” only one definition of “Creole,” and only one valid version of the city’s history.
Official neighborhood delineations, arbitrary as they may be, are nevertheless consequential because the resulting polygons drive statistical aggregations of everything from population to crime rates, real estate values, and recovery metrics. They produce their own reality, and I myself recognize that they are necessary. The facts and figures produced by the Greater New Orleans Community Data Center, the reporting of The Lens, and my own geo-statistical number-crunching all require that crude patches be imposed upon the urban fabric. Official geographies therefore influence policy, politics, and resource allocation—as well as the formation of neighborhood associations, with their notoriously uneven levels of civic clout. Officially defined neighborhoods are a necessary evil, an important delusion, a fake reality. They should be viewed as useful cartographic and statistical tools—and no more.
Such a viewpoint comes with benefits. Consider, for example, that neighborhoods are often better defined by their cores than by their peripheries. Nearly everyone agrees, for example, that Coliseum Square forms the heart of the Lower Garden District, and that the Canal/Carrollton intersection forms the core of Mid-City. But hardly anyone agrees on those neighborhoods’ outer limits. So be it! Let your neighborhood perception extend from a universally recognized core, and bleed gradually into adjacent areas. Similarly, consider that avenues tend to unify, not divide, residents on either side. Think how different Bywater would be if we considered St. Claude Avenue to be its linear axis rather than its divisive edge.
Doing so might help us realize that our interests may also be their interests, that our backyard is also their backyard.
Tulane geographer Richard Campanella (rcampane@tulane.edu) is the author of “Bienville’s Dilemma,” “Geographies of New Orleans,” “Lincoln in New Orleans,” and other books. His work may be perused at http://richcampanella.com. For more on this particular topic, see